The Den
Your trades and statistical information.
Performance and Statistics
Import all of your trading data into the Den, where it'll be presented in graphs and charts, making it easy to interpret your performance as well as identify weaknesses in your trading. Your Journal Entries (Traders Wall) are paired with the trades as you import them.
Dashboard
The dashboard is the landing page for the Den and gives you an overview of a wide range of trading statistics based on a monthly timeframe. This includes a calendar for the month, equity and P&L chart, as well as some vital performance matrices like your win rate, drawdown, expectancy ratio, etc.

Calendar
Trades and journal entries are paired on the daily calendar. The daily calendar is interactive, so clicking on a day will present you with your daily summary, which includes trades and journal entries for that specific day. You can also visualize your performance with different timeframes, such as the Weekly, Monthly and Yearly calendar.

Daily Summary
This is where your journal and trades come together.
Select a day from the daily calendar to get a summary of your daily trades and journal entries. The summary includes your daily P&L curve, some statistics like the win rate, average win and loss and your daily P&L. There is also a table of your daily trades which is also interactive, so clicking on a specific trade will present you with the trade-related details.

Performance
Visualize your performance with your equity curve, profit and loss charts, as well as some of your key trading metrics. Zoom into specific periods of time with the date filter or one of the quick filters.

Data Statistics
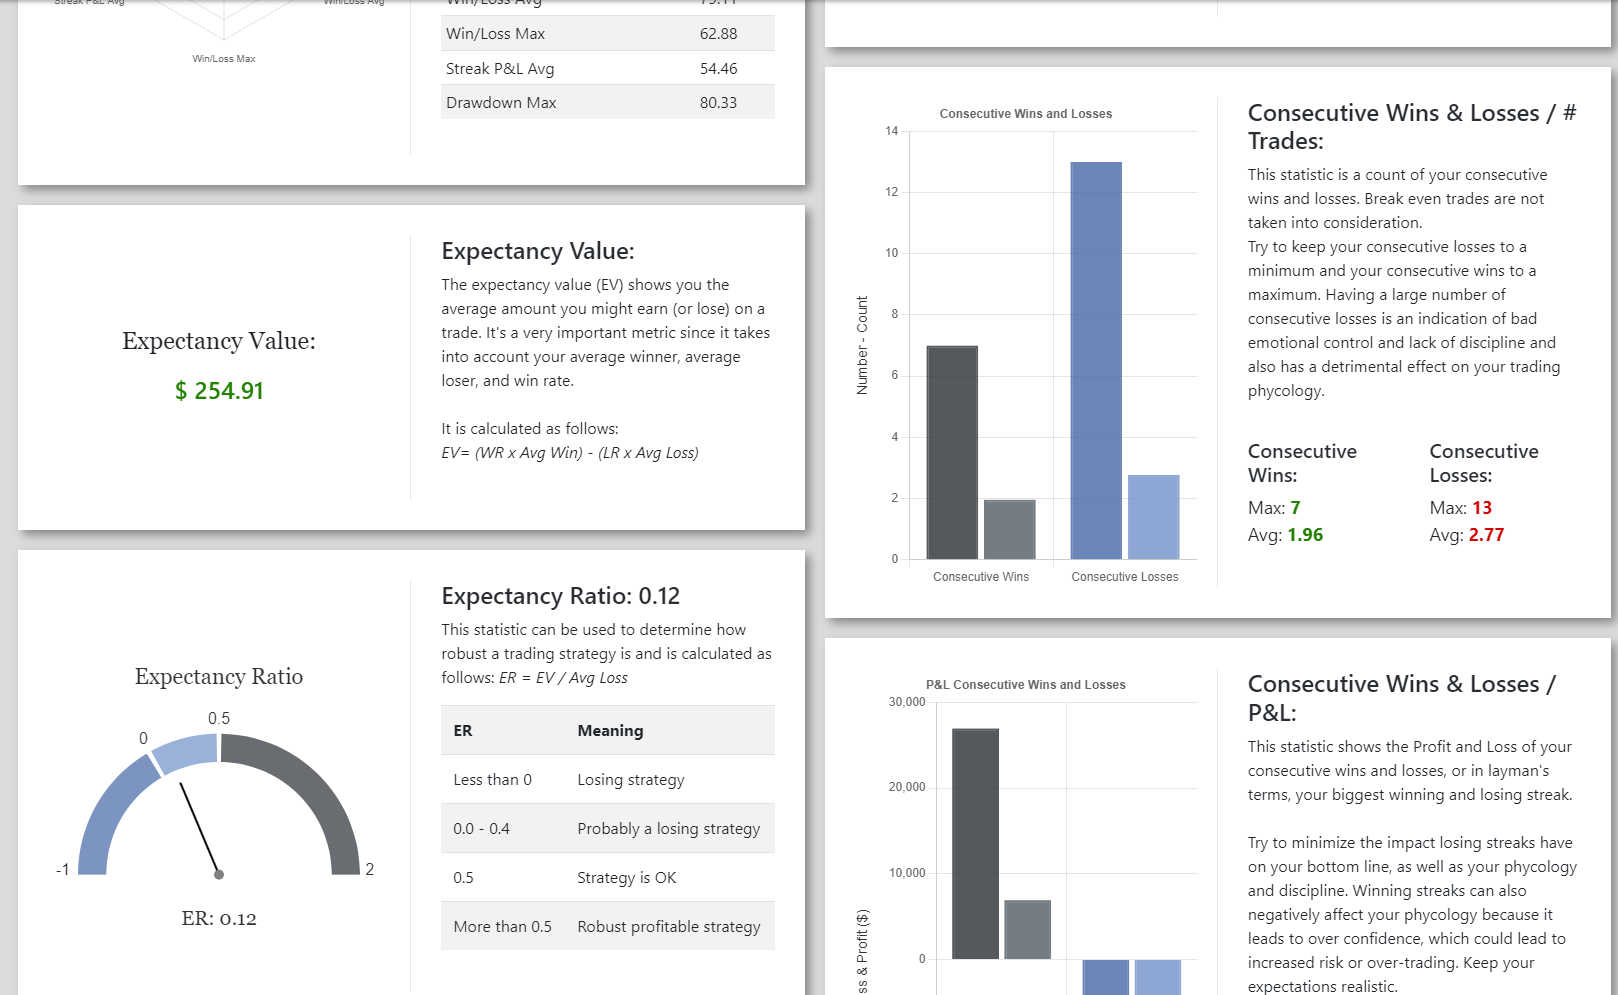
Perfomance based metrics in an easy to understand visual representation
These metrics includes your win rate, expectancy value and ratio, the number of consecutive wins and losses and much more. These matrices are key to identifying key issues in your trading and improving your edge.

Time Statistics
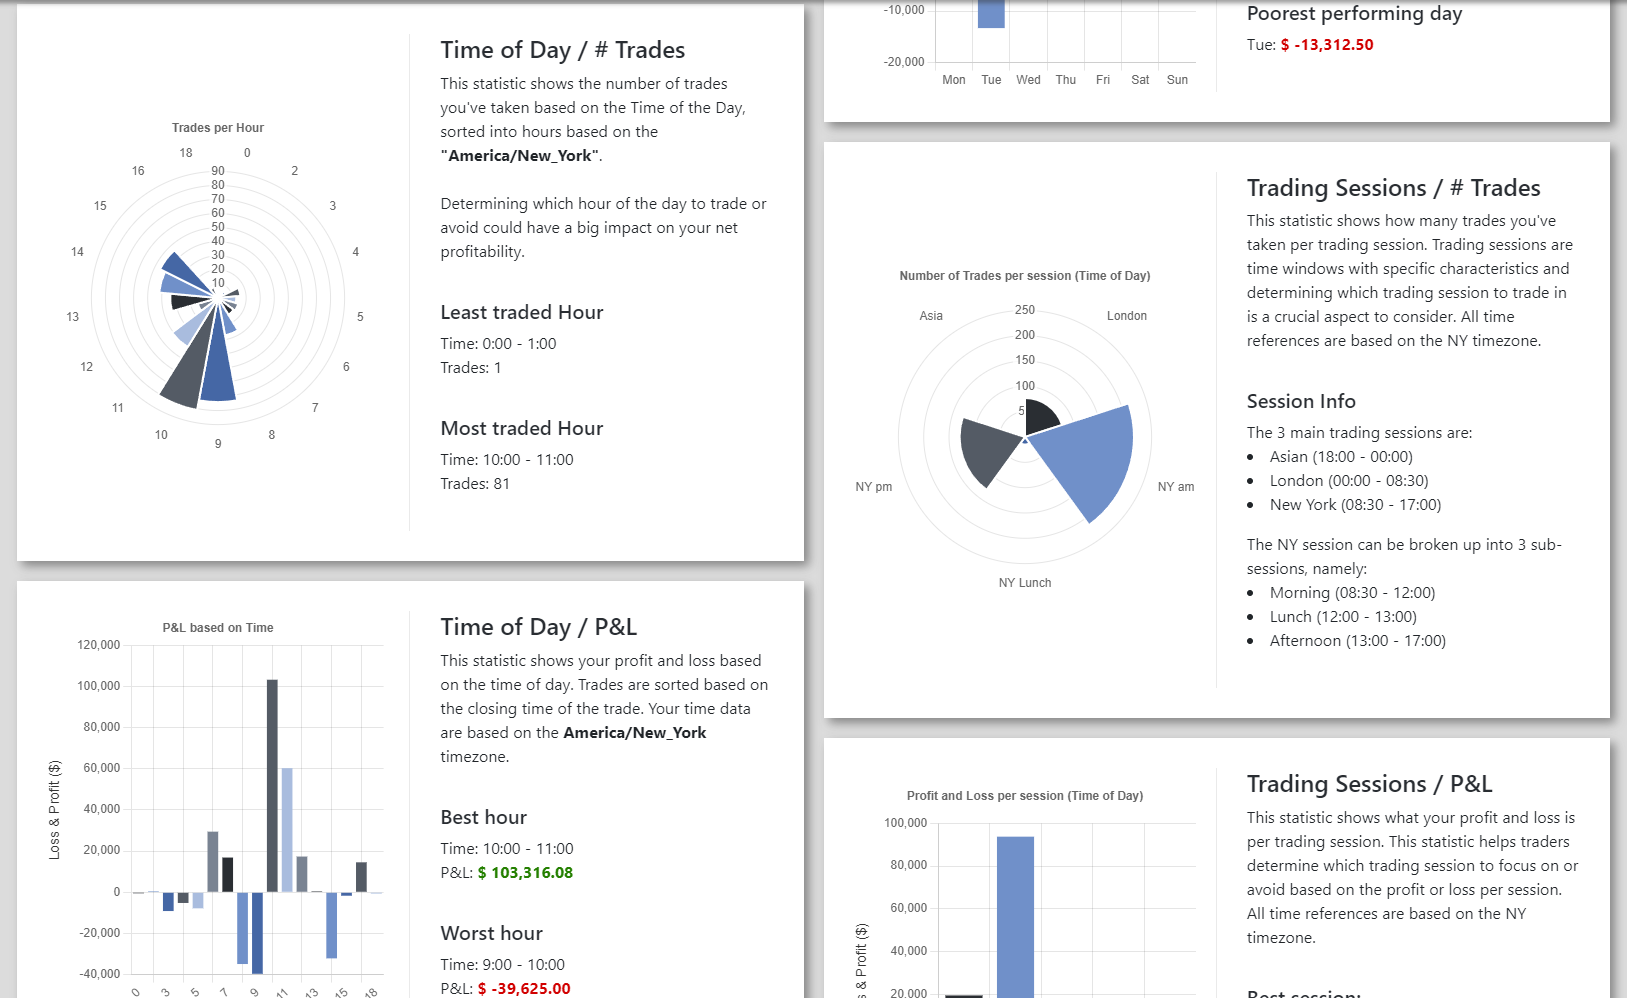
If you're serious about becoming a better trader, time-based statistics are crucial. There are only dimensions in trading and that is time and price. Traders understand that repeating patterns happen at specific points in time and all you need to be a profitable trader is one repeating pattern.
These statistics includes the number of trades and P&L based on the time of day, trading session and the day of the week as well as your P&L based on your holding time.

Let's get your account set up so that you can import your trades.
If you already have an account, please log in.